America is such a hotbed of political debate that, sometimes, it seems all we can really agree on is wanting to argue. This is why it's good to take note when the majority of Americans share the same opinion, as seen in a recent Gallup poll where 72% of voters said gun policy was very or extremely important.
What's more, according to the Pew Research Center, 89% of American adults said people with mental illnesses should be prevented from buying guns. Republicans and Democrats also favored adding background checks for people buying guns privately and from gun shows.
So the question begs to be asked: What do the numbers really say? Do gun laws make a difference in America? Does restricting access to firearms affect gun violence? While mass shootings are jarring and horrific, are assault rifles really causing the most bloodshed?
To answer these questions and generate perspective about gun flow in America, we set out to explore the data provided by multiple government agencies and dedicated gun policy organizations. Read on to see what we discovered about the gun climate in America.
Where Do We Really Stand With Gun Laws in America?
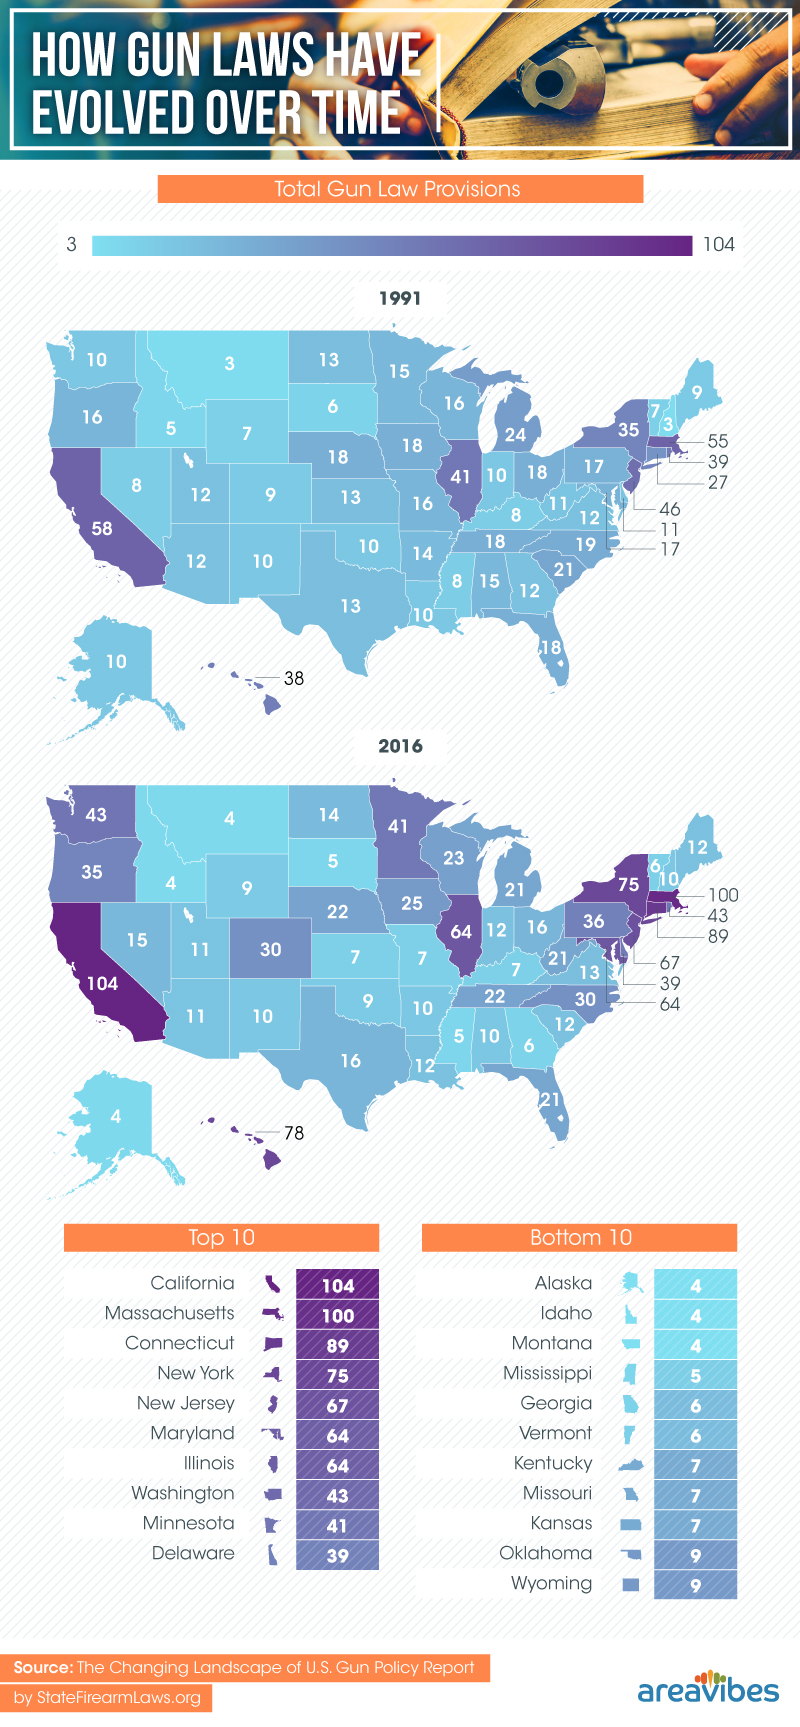
According to the Pew Research Center, nearly 6 in 10 adults in America want stricter gun laws. But is this majority being heard? Despite 3 in 4 adults believing the current administration won't do anything about gun policy by the end of the year, change has been happening.
Over the 25-year span tracked by the project, California, Massachusetts, Hawaii, and New York essentially doubled the number of gun provisions in place. Connecticut tripled – and Washington quadrupled – their legislation. According to this data, the states with the most aggressive gun laws were California, Massachusetts, Connecticut, Hawaii, and New York, followed closely by New Jersey.
Using data carefully compiled by the State Firearm Laws project, we can take a close look at how the landscape of gun policy in America has progressed from 1991 to 2016. It's pretty clear which states have put a priority on gun policy based on not only the number of provisions enacted but also the intensity of change in those states – which is better seen in the maps below.
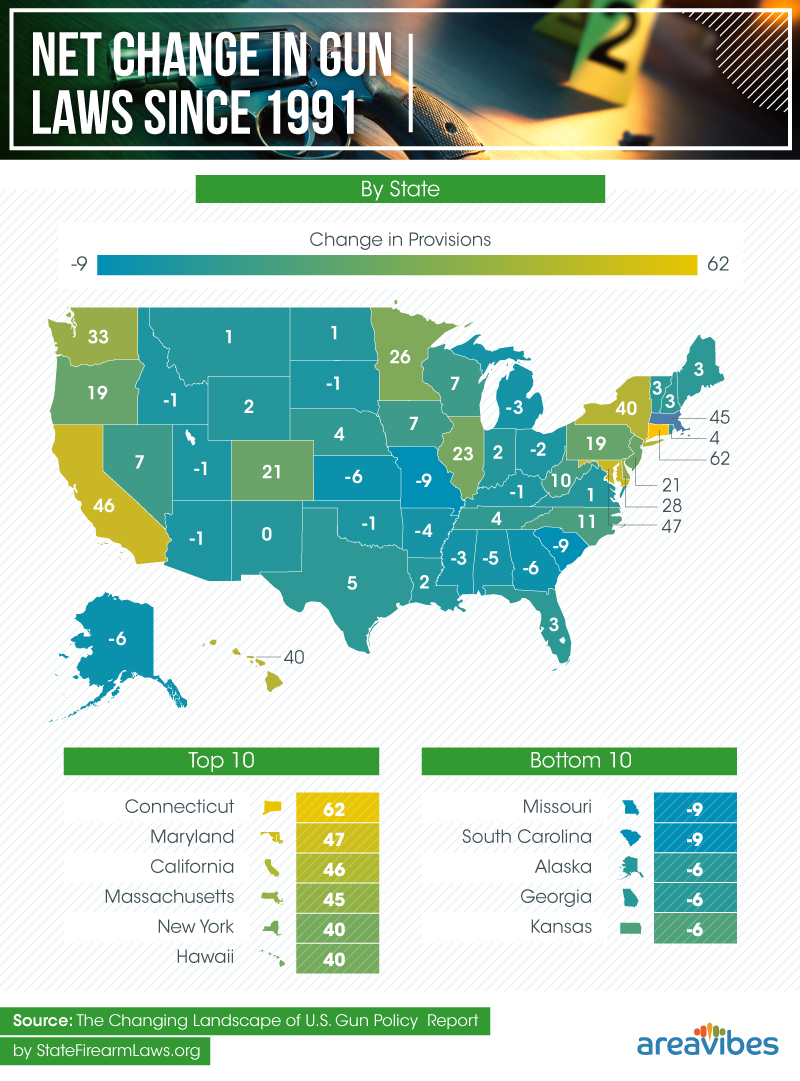
Likewise, we discovered which states were seemingly anti-gun laws. Across the Deep South, America wore a belt of states with dropped gun provisions in the 25 recorded years. Significantly, Missouri and South Carolina removed nine laws, and Kansas, Georgia, and Alaska removed six gun provisions from their books between 1991 and 2016. It's no surprise, then, that these states all received a grade of "F" on the Giffords Law Center Annual Gun Law Scorecard. So which states have the least aggressive stance on guns? Idaho, Montana, and Alaska with only four gun provisions apiece. These were closely followed by South Dakota and Mississippi with five and Vermont and Georgia with six.
From 1991 to 2016, all 50 states increased America's standard of gun control by increasing the total laws in place from 861 to 1,286. However, just 12 states are responsible for over 76% of the laws currently in effect, and many states only employ one or two forms of legislation rather than the more comprehensive approach taken by states like Connecticut and California. With such a high concentration of laws in a small percentage of the country, what is their real impact on gun crime?
With More Gun Laws, Is Gun Crime Getting Any Better?
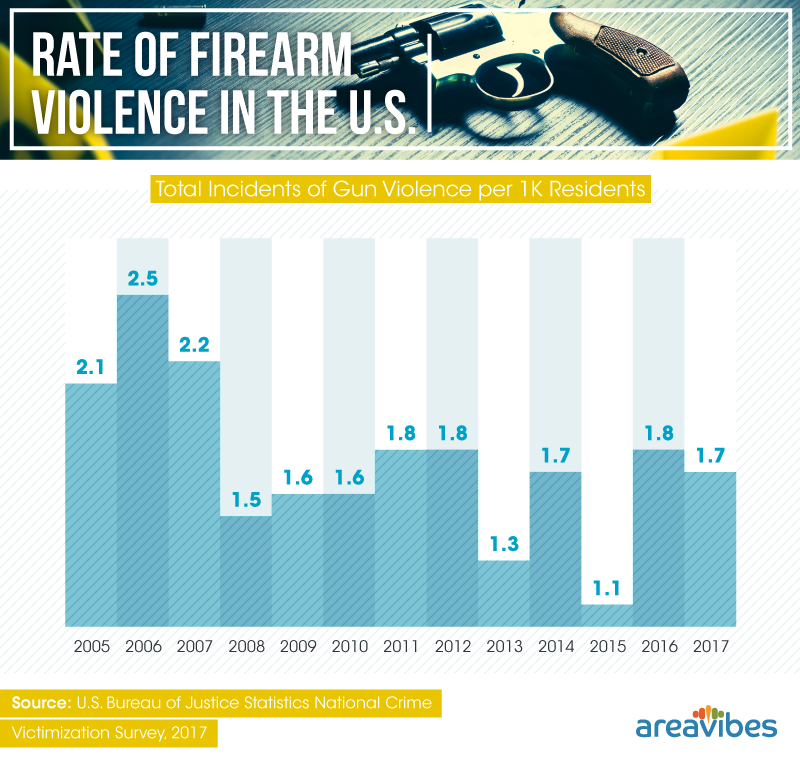
The good news: Gun crime is decreasing in the U.S. overall. A quick look at data provided by the U.S. Bureau of Justice Statistics' National Criminal Victimization Survey shows the downward trend from 2005 to 2017. However, it also reveals that while there were winning years like 2015 with only 1.1 incidents per 1,000 people, 2016 and 2017 jumped back up near the previous years' collective average of 1.8 incidents.
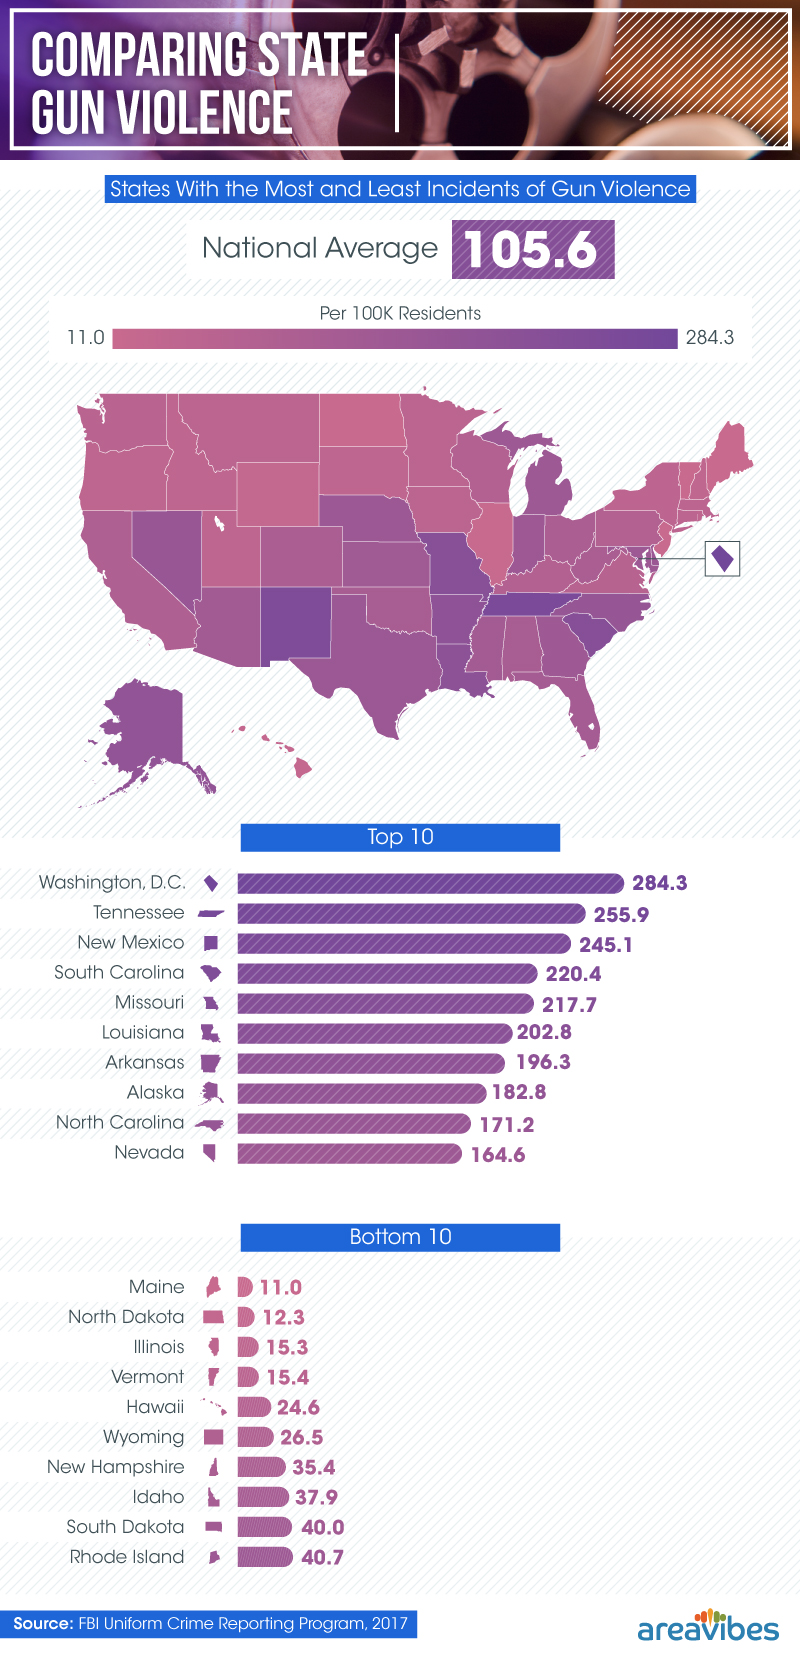
Three states rang the alarm with gun crime rates above 220 incidents per 100,000 people: Tennessee with 255.9 incidents, New Mexico with 245.1, and South Carolina with 220.4. How did these states stand in laws enacted? Tennessee has 22 gun laws, which puts it in the top 20 strictest states. Conversely, New Mexico has 10 – the same as Alabama, Arkansas, and New Hampshire, all of which appeared close to the bottom of the list with gun crime rates of 114.2, 196.3, and 35.4, respectively. It's interesting to note that these rates –which are an overall look at firearm incidents – don't match the more reported statistics on gun murders.
Interestingly, there is not a guaranteed correlation between states with more laws and less crime. Illinois, which has the third-lowest rate of gun crime per 100,000 people, was seventh for total laws in place at 64 firearm provisions. At the same time, Maine and North Dakota, touting the lowest rates of gun crime per 100,000 residents, had 12 (Maine) and 14 (North Dakota) firearm provisions in place.
One might wonder if these crime rates have anything to do with the number of registered guns in each state. But the truth is a bit more complicated than that.
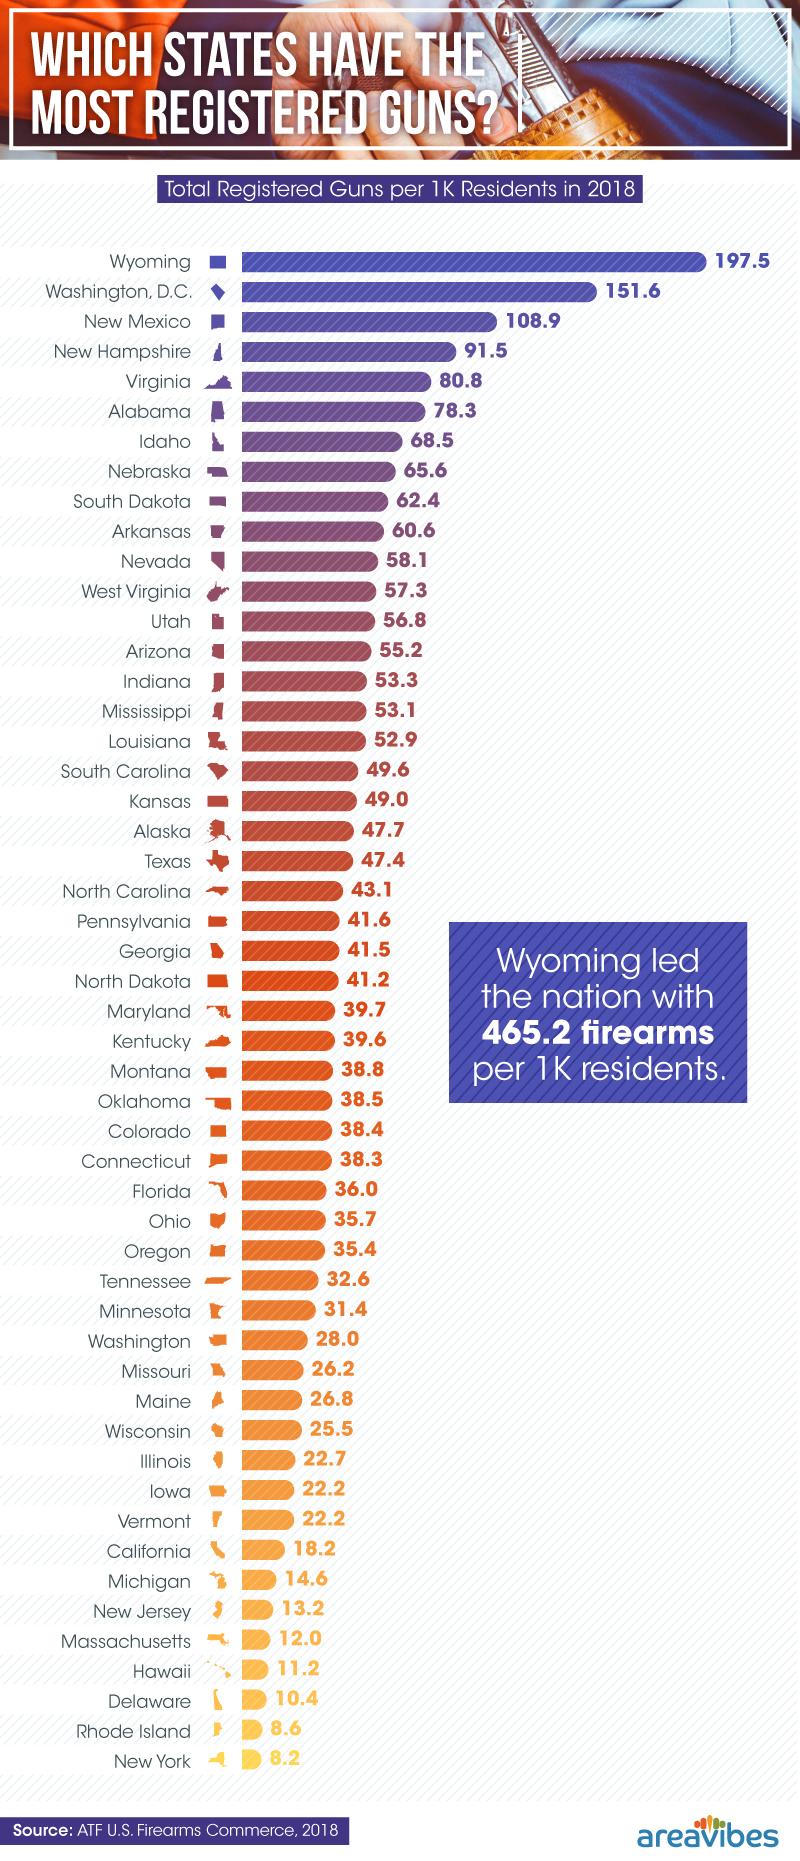
When we compared the 10 states with the least registered guns per capita to the crime rate data, none were also in the top 10 states for gun crime. However, relying on this oversimplified statistic would be cherry picking, as the correlation becomes extremely muddled from there.
Wyoming, the state with the sixth-lowest crime rate, was No. 1 for registered guns with 465.2 guns for every 1,000 residents. This was over four times as many guns per capita as the No. 2 state in registered firearms: New Mexico. However, New Mexico defies the correlation with one of the highest gun crime rates in the nation.
Tennessee (No. 1 for the highest crime rate) ranked 34th for registered guns per capita, while Maine (No. 1 for the lowest crime rate) and Illinois (No. 3 for the lowest crime rate) ranked at 38th and 40th, respectively, for registered guns per capita. Vexingly, for the top 10 states with the highest rates of gun crime, only three were also in the top 10 states for registered guns: New Mexico (No. 2 for the highest crime rate), Arkansas (No. 8 for the highest crime rate), and Nevada (No. 9 for the highest crime rate).
Clearly, it's not a matter of how many registered guns are in the state. Although most Americans agree on gun provisions to include background checks, the guns being used in crimes are not always acquired through traditional methods. In fact, public health researchers at the University of Pittsburgh found the majority of guns recovered from crime scenes by law enforcement don't belong to the perpetrators.
Where Are the Guns Coming From?
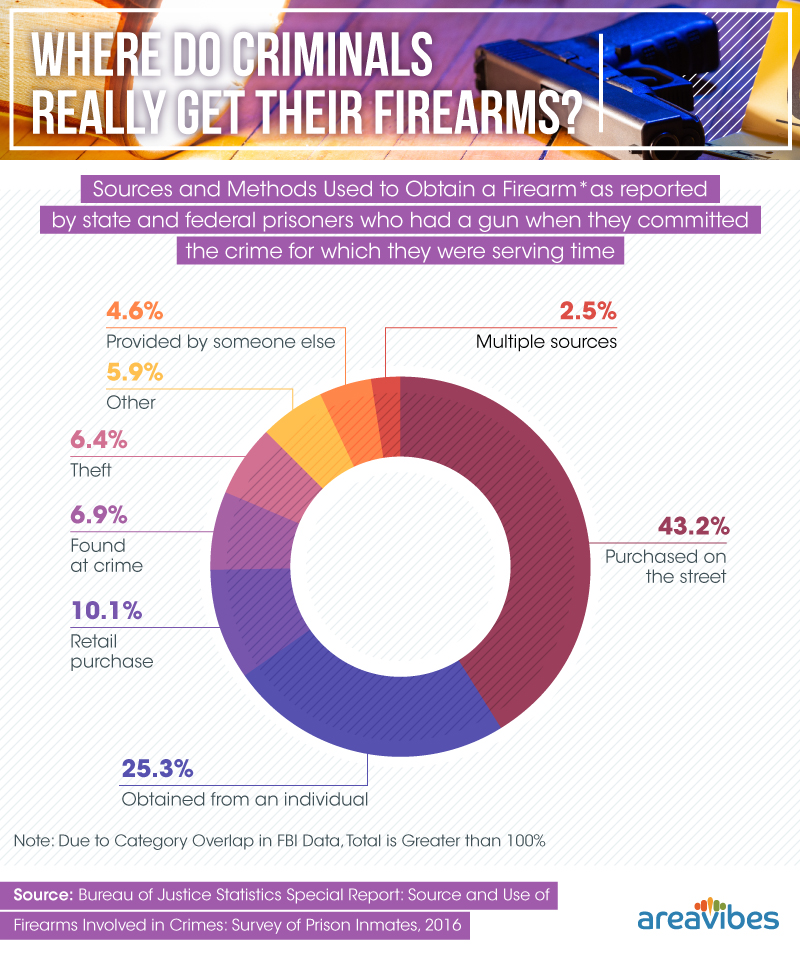
The Bureau of Justice Statistics surveyed prison inmates in 2016 to learn more about the firearms used in crimes. What they found is very revealing.
Only 1 in 10 firearms used to commit crimes were purchased in a retail fashion, which includes everything from gun and pawn shop purchases to gun shows. That means only 10% of all firearms used in crimes are tracked by the government and controlled by the provisions put in place, and even then, law enforcement is somewhat hampered in tracking these legally acquired guns over time.
Instead, nearly 70% of firearms used in crimes were acquired off the street in illegal sales or gained from a family member or friend. This indicates the true bulk of all firearm crimes come from sources untracked and not controlled by gun laws.
What's more, while assault rifles and mass shootings really get Americans' blood boiling and engender majority support for stricter gun laws, that support always fades after a few months. Why does this matter? Because assault rifles are not the real cause of firearm trouble in America.
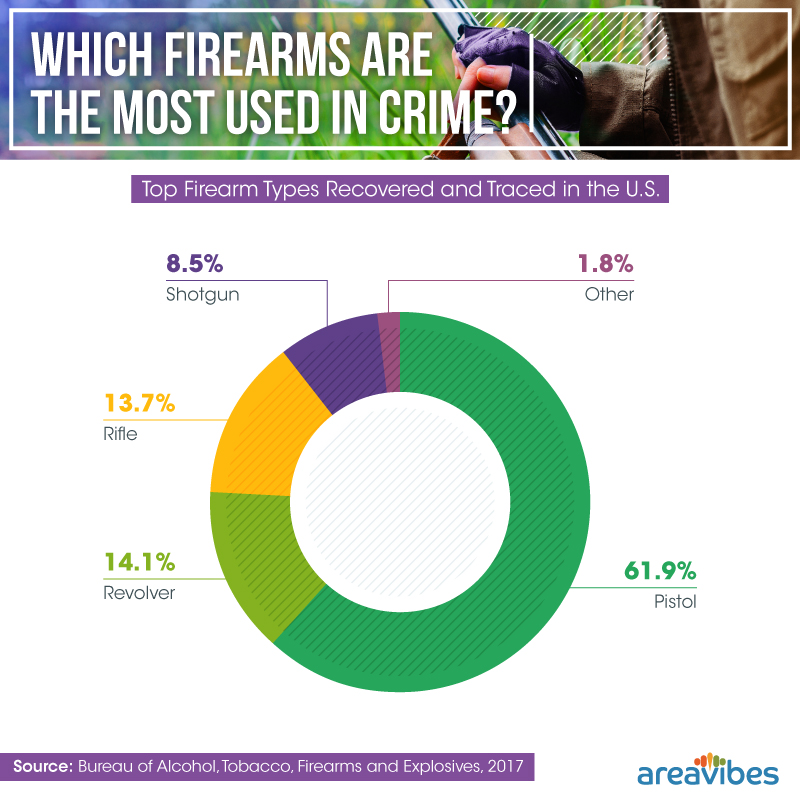
According to data collected by the Bureau of Alcohol, Tobacco, Firearms and Explosives (ATF), 76% of firearms used in crimes are handguns, and additional research shows they are responsible for around two-thirds of all gun-related homicides.
In short, this means pistols and revolvers are the deadliest weapons in circulation and, perhaps, the largest threat to American safety. While rifles might be flashier or scarier, handguns are easy to conceal, steal, and transfer from one place to another.
Gun Flow in America
Registered gun owners are not a threat, and having more gun laws does not guarantee peace and quiet in your neck of the woods. The states with the most gun laws were home to cities with the most reported incidents of gun violence.
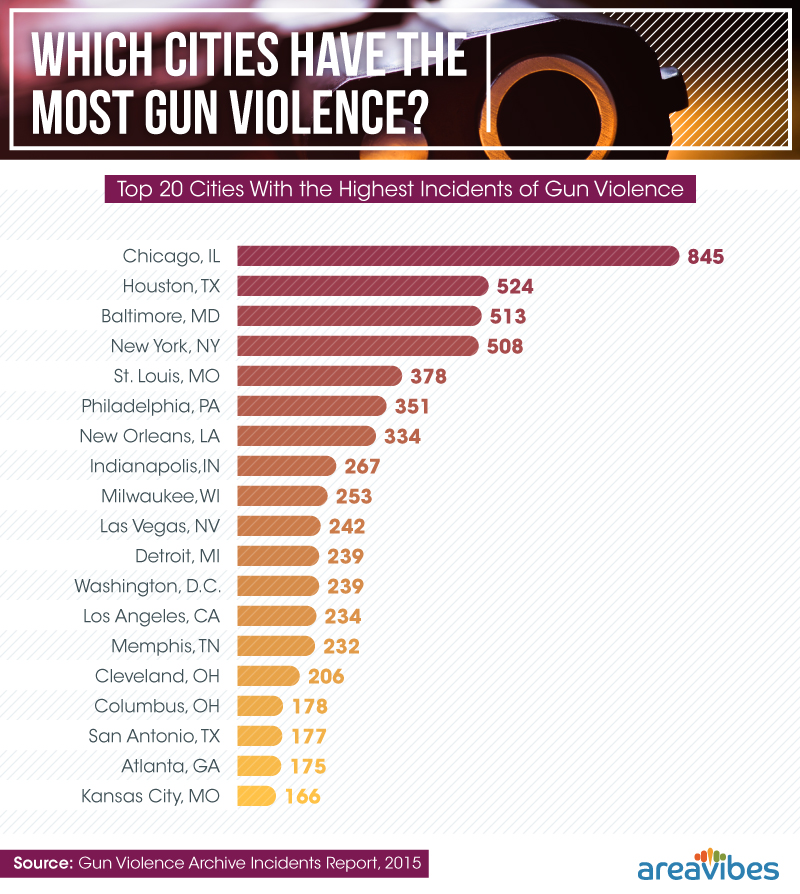
For example, Chicago, which is the No. 1 most active city for gun violence, is in Illinois, a state with 64 gun laws. Baltimore is also governed by 64 gun laws in Maryland, and New York City is in a state with 75 gun provisions. Even California, the state with the most gun laws of all (104) is home to Los Angeles: No. 13 for gun crime.
More importantly, Illinois, New York, California, Michigan, and Missouri all fell within the 14 states with the least number of registered guns per capita: less than 27 guns for every 1,000 residents.
So where are the guns used in these crimes coming from? Our search for perspective in the American firearm landscape brought us to this question: Are gun laws really making a difference in stopping guns from being used in crimes?
When any branch of law enforcement recovers guns, the ATF steps in and does their best to trace those guns back to the source – in other words, to the last registered retail seller. The majority of guns used in gun crimes come across state borders.
Using this data, we compiled an interactive map of the flow of firearms in America for 2017, showing the top five states importing firearms for criminals in another state.
For example, California has 104 gun laws and only 18.2 guns for every 1,000 residents, yet it still ranked 27th with a gun crime rate of 90.8 incidents for every 100,000 people. California is the strictest state regarding gun control. So where do guns come from to arm criminals?
Use the drop-down list to select California on the interactive map above. We see five distinct arcs from Arizona, Nevada, Texas, Washington, and Oregon. The varying thickness of the arcs indicates how many firearms were recovered from each state.
Hover over the thickest arc from Arizona, and you can see 1,184 firearms were imported into California and recovered by law enforcement. That's 1,184 guns from one supply state in a state fighting as hard as possible against its gun crime. To be sure that proximity isn't necessarily the key to this illegal flow of firearms, note that Texas supplied nearly 500 guns to California. Overall, in 2017, California law enforcement recovered 3,130 firearms from these top five states, although its broader efforts to confiscate firearms have been a persistent difficulty.
What is the key? Well, there's one lingering realization when you compare these maps with the maps of total gun provisions in each state. Of California's top three providers for illegal firearms, all three are significantly less strict with the gun laws enforced. Arizona has only 11 gun laws in place, Texas has 16, and Nevada has 15.
Another interesting example is Tennessee. Tennessee has the highest gun crime rate in America. However, it ranked in the top 20 for gun laws (with 22) and in the bottom 17 states for registered guns. The key to why this state still struggles with so much gun crime may be in the states surrounding it.
The top five importing states are Georgia, Mississippi, Alabama, Kentucky, and Florida. In total gun provisions, Georgia only has six, Mississippi has five, Alabama has 10, Kentucky has seven, and Florida has 21.
Without any support from its bordering states, Tennessee's gun provisions seem to offer no protection to its citizens, especially since this state is right in the middle of a firearms smuggling route known colloquially as the "Iron Pipeline." Every year, hundreds of guns are illegally moved from these southern states up to New England, which is working overtime in the struggle to enforce its copious gun laws.
So What About Gun Laws?
Explore our interactive map and see for yourself: The trend is the same all over America. States suffering from high crime rates (or smaller hot spots of gun crime) ratchet up their gun control efforts year after year to varied effect. Meanwhile, neighboring states act more complacent about gun control.
The result? From one perspective, we have a thriving industry for firearm trafficking across state borders and the revelation that, perhaps, gun crime can't be controlled on a state-by-state level. Although it's hard for states with less concern about firearm crimes to see, relaxed attitudes simply create an opportunity for ambitious criminals willing to travel.
From another perspective, states and cities with stricter gun control laws are the focus of so much weapons trafficking because criminals perceive them as vulnerable populations.
Whichever of these deeply polarizing perspectives might hit closer to the reality of the problem, one truth seems evident. After exploring firearm crime rates, the existing gun laws in states across America, the status of registered guns, and the sources of illegal guns recovered by law enforcement, the big picture is different than expected. Are gun laws really helping? To some extent, yes.
More importantly, the facts suggest that gun crime is not an issue that can be resolved at a local level. Rather, this may be a situation in which the nation must stand together and defend its people with the right laws (or lack thereof) to protect all borders, or we will remain divided and weak in the battle against gun crime.
Methodology
This project relied on several data sources from both law enforcement and nonprofit groups. The "Rate of Firearm Violence" was pulled directly from information found in the Bureau of Justice Statistics' National Criminal Victimization Survey from 2017. State gun crime was determined using data from the FBI's Uniform Crime Reporting Program detailing total numbers of three crime categories committed with a firearm per state (murder, robbery, and aggravated assault). The total of these crimes was calculated for each state, and then divided by the state population according to the totals provided by the U.S. Census Bureau for 2017 and multiplied by 100,000 to calculate the rate per 100,000 people.
Using data provided by the ATF in its report, "Number of Firearms Sourced and Recovered in the United States and Territories," we pulled totals for each state. Then, using population totals provided by the U.S. Census Bureau for 2017, we calculated the rate per 100,000 residents. Cities with the highest incidents of gun violence were sourced from the GunViolenceArchive.org database for 2015. Firearms recovered by type were sourced directly from the ATF's "Firearm Types Recovered and Traced in the United States and Territories" database for 2017. States with the most registered firearms were sourced from the ATF's "Firearms in the United States Annual Statistical Update 2018," and rate per capita was determined using 2017 population data from the U.S. census. Gun laws per state were provided by StateFirearmLaws.org for 2018. Data for "Where Do Criminals Really Get Their Guns?" was sourced from "The Bureau of Justice Statistics Special Report: Source and Use of Firearms Involved in Crimes: Survey of Prison Inmates, 2016."
The "Flow of Firearms in America" interactive map was created using the "Number of Firearms Sourced and Recovered in the United States and Territories" database provided by the ATF.
Sources
- https://news.gallup.com/poll/244367/top-issues-voters-healthcare-economy-immigration.aspx
- https://www.pewresearch.org/fact-tank/2018/12/27/facts-about-guns-in-united-states/
- https://www.cbsnews.com/news/gun-policy-public-opinion-a-year-after-parkland-shooting/
- https://www.vox.com/2019/3/8/18254626/mass-shootings-gun-violence-laws-study
- http://statefirearmlaws.org/sites/default/files/2017-12/report_0.pdf
- https://www.cnn.com/2017/10/02/politics/gun-control-polling-las-vegas-shooting/index.html
- https://www.washingtonpost.com/news/politics/wp/2017/11/07/where-the-guns-used-in-chicago-actually-came-from/?noredirect=on&utm_term=.d435422205d8
- https://lawcenter.giffords.org/scorecard/
- https://www.bjs.gov/index.cfm?ty=dcdetail&iid=245
- https://www.washingtonpost.com/graphics/2017/national/assault-weapons-laws/?utm_term=.082ddc6bdc26
- https://www.worldatlas.com/articles/us-states-with-the-highest-level-of-gun-violence.html
- https://www.rand.org/research/gun-policy/analysis/supplementary/firearm-prevalence-violent-crime.html
- https://lawcenter.giffords.org/gun-laws/policy-areas/gun-sales/maintaining-records-of-gun-sales/
- https://www.upmc.com/media/news/fabio-firearms
- https://www.bbc.com/news/world-us-canada-41488081
- https://www.axios.com/chicago-gun-violence-murder-rate-statistics-4addeeec-d8d8-4ce7-a26b-81d428c14836.html
- https://www.atf.gov/firearms/national-tracing-center
- https://www.sfchronicle.com/politics/article/California-struggles-to-seize-guns-from-people-13624039.php
Fair Use Statement
The use of firearms and how they are regulated across America is a pressing national issue, and we believe the public deserves to be well-informed. Keeping this goal in mind, you may freely share this content for any noncommercial purposes. If you do, please include a link to this page so that others can find all our data.

